Introducing Analytics 📊


Getting some extra motivation really helps me put in the effort to do more sales. So I think it makes sense for a CRM to show data that will get you going rather than just giving managers more sense of control.
Last week I decided to introduce some helpful numbers and charts to Wobaka and after a bunch of mockups and iterations I'm happy to share the first version of analytics with you :).
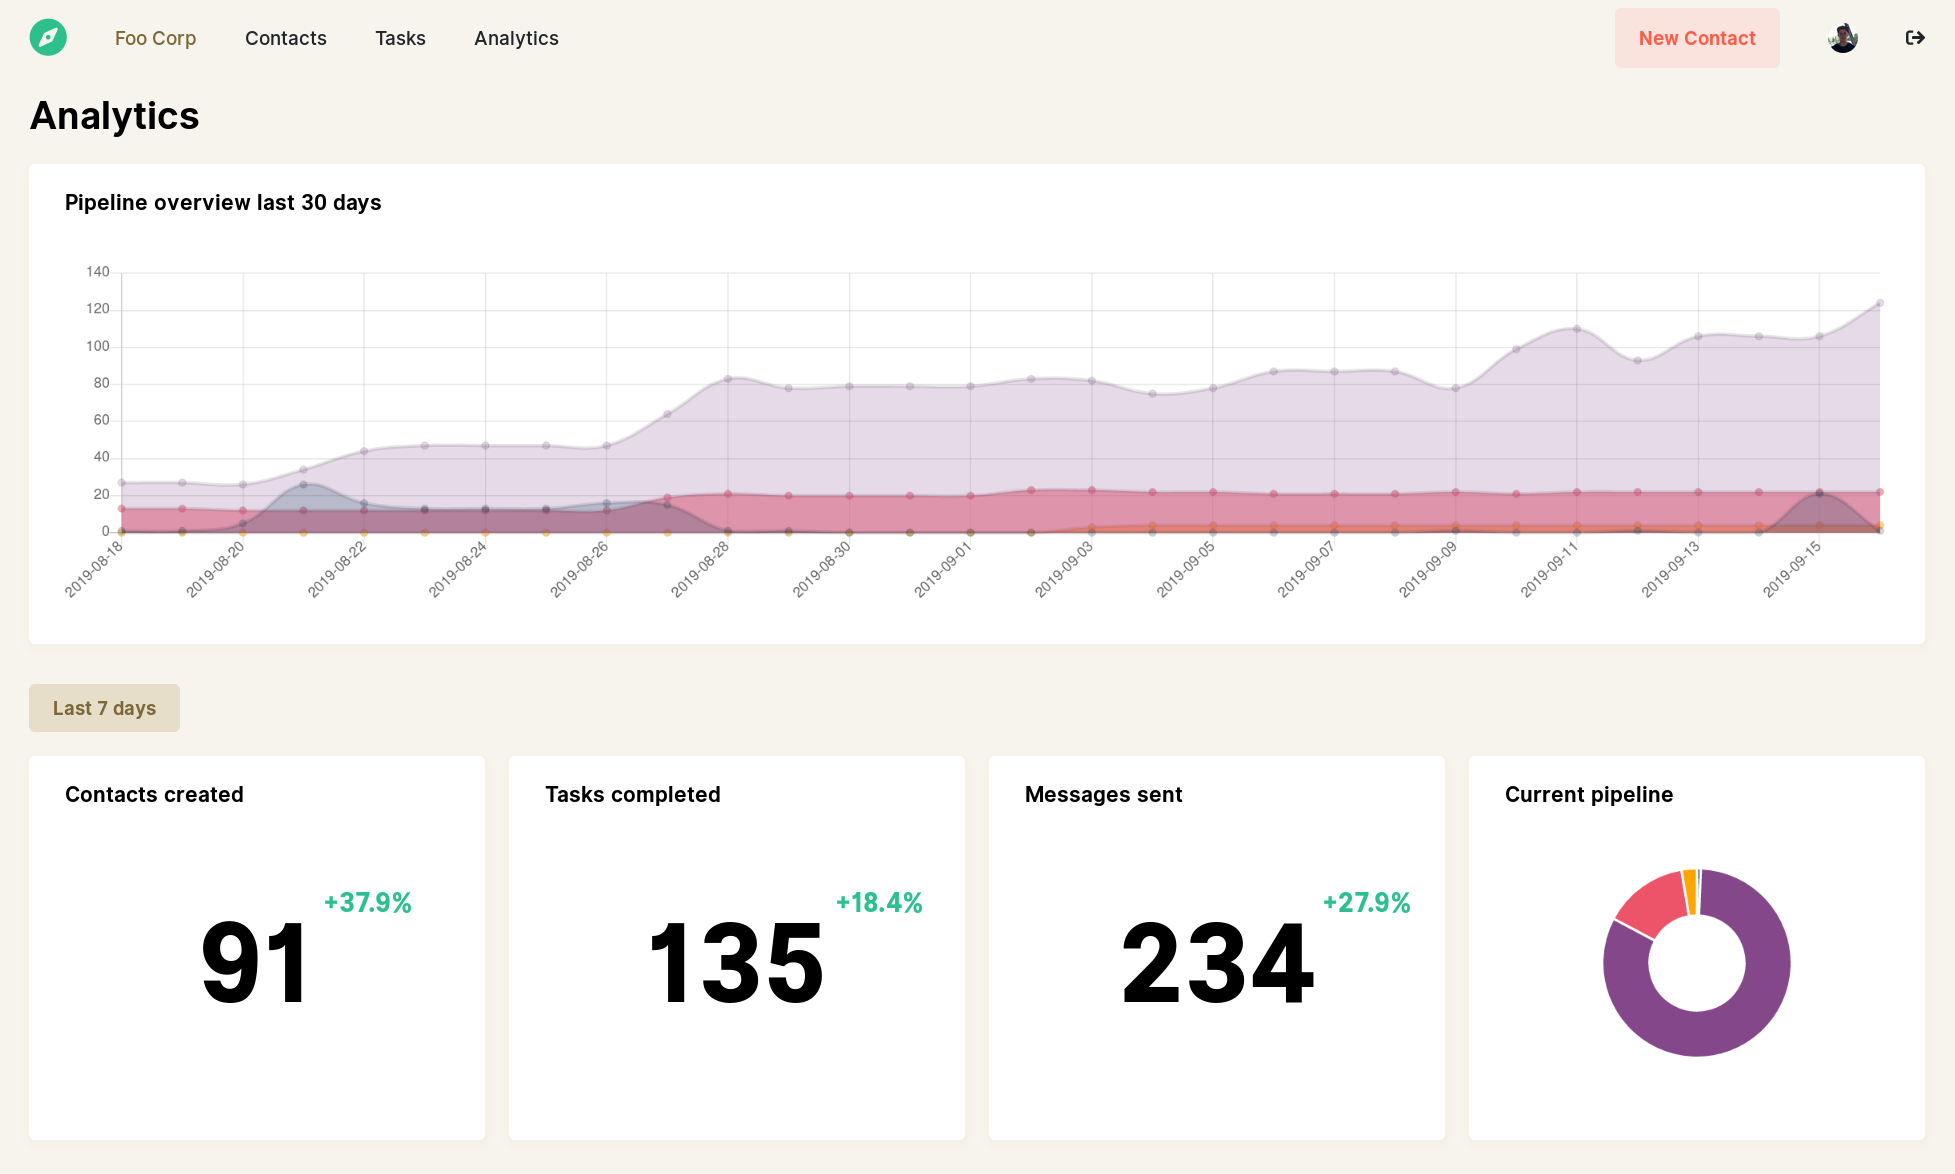
It shows you how your pipeline has developed the past 30 days so you can see if you're on the right track. It also shows you some statistics about your team's activity the past 7 days. This way you'll always know whether you're lagging behind, staying ahead, or keeping the pace.
I hope you'll enjoy it as much as I do. And what would this blogpost be without a screenshot, so here you go :)!