Redesigning Pipeline Stages


Pipelines are an important part of Wobaka and allows you to easily track deals accross stages, like in a kanban board. Recently, more people have started adding multiple currencies and different kinds of deal values like annual, monthly and one-time. To give you a better overview of your current pipeline I decided to redesign the stages a bit.
Before
This is what the stages looked like before the change. Pretty clean and simple.
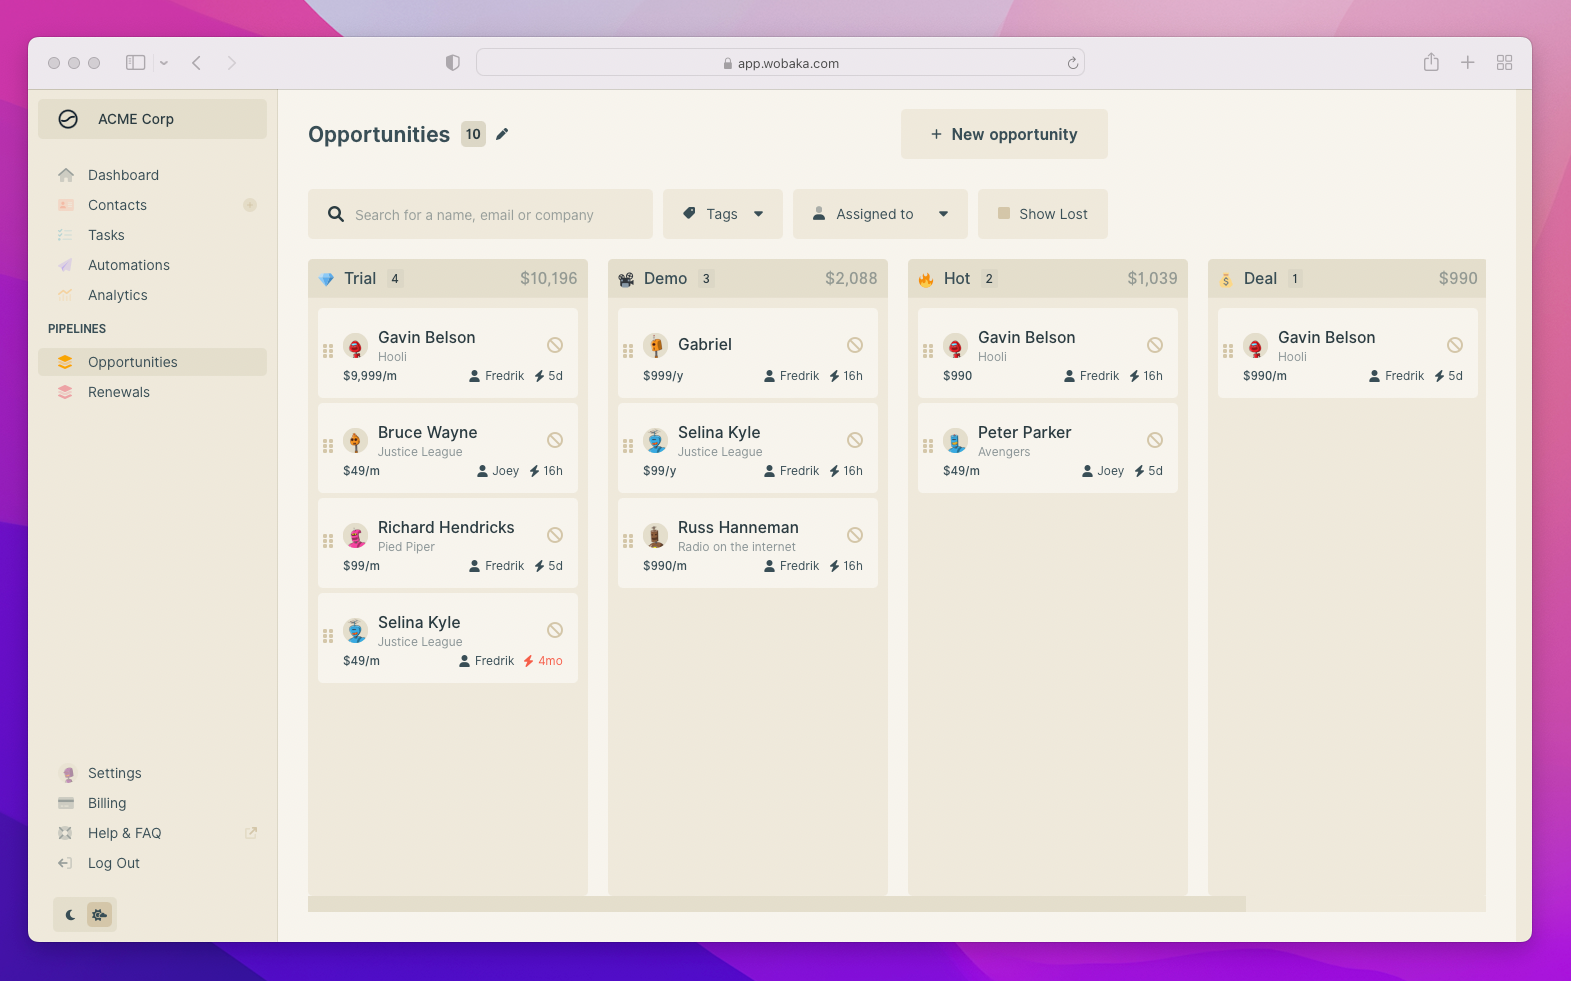
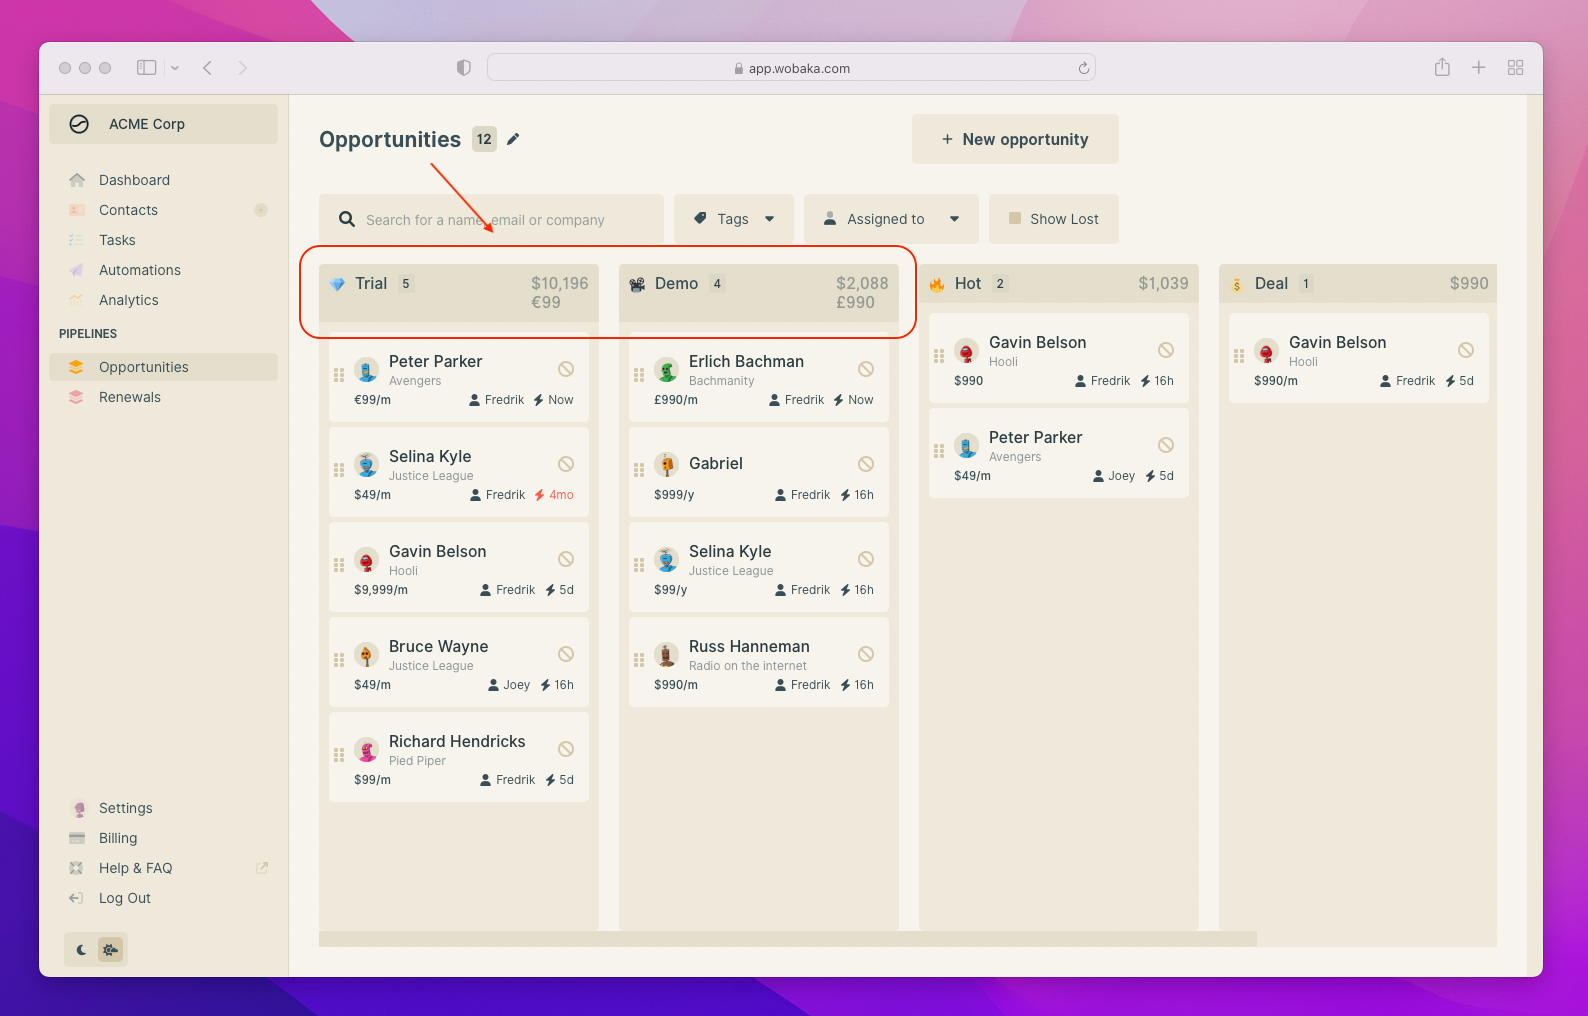
The problem with this design is that it shows the sum of all your deal values as one. No matter if it's annual, monthly or one-time values. Another issue is that if you add more currencies it starts to look a little weird. Now imagine having 3+ currencies in a stage. 😱
In order to design somethings that scales better and is more functional, I headed to the drawing board. After trying out a few different concepts, this is what I came up with.
New design
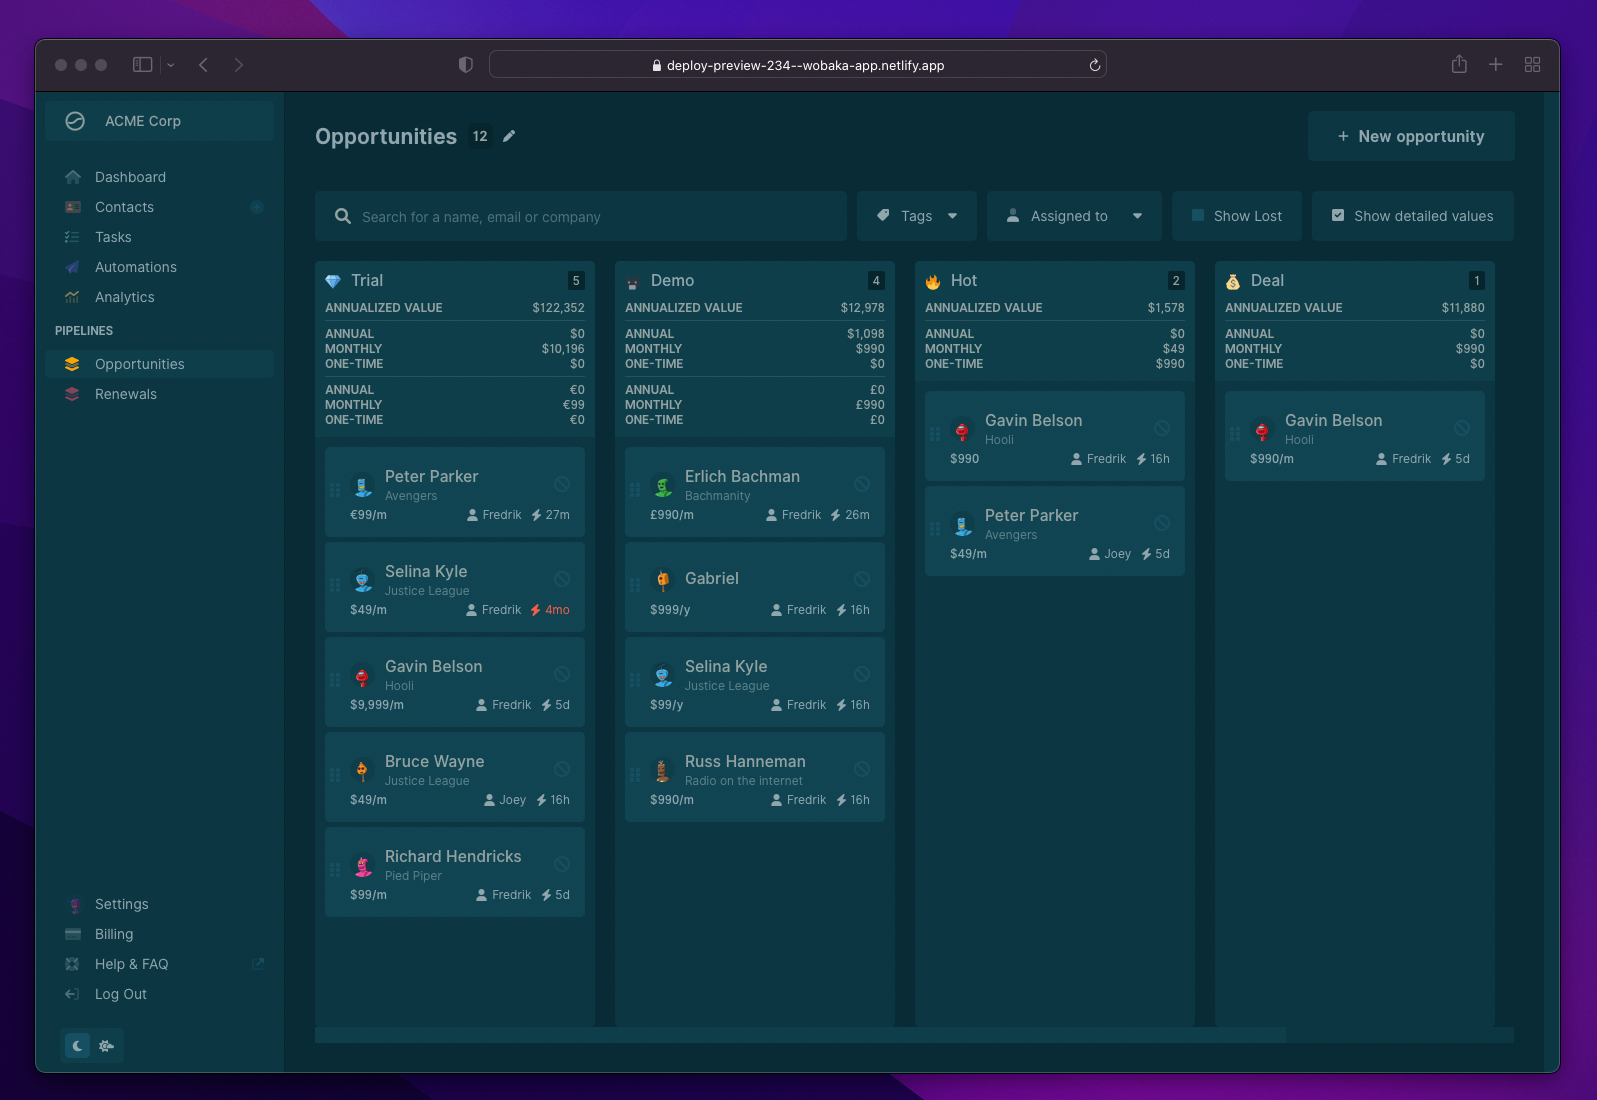
First of all, the top header row only shows number of opportunities in the stage. The second row shows a total annualized value. This is basically an estimated sum of your monthly deals multiplied by 12 added to your annual and one-time deal values.
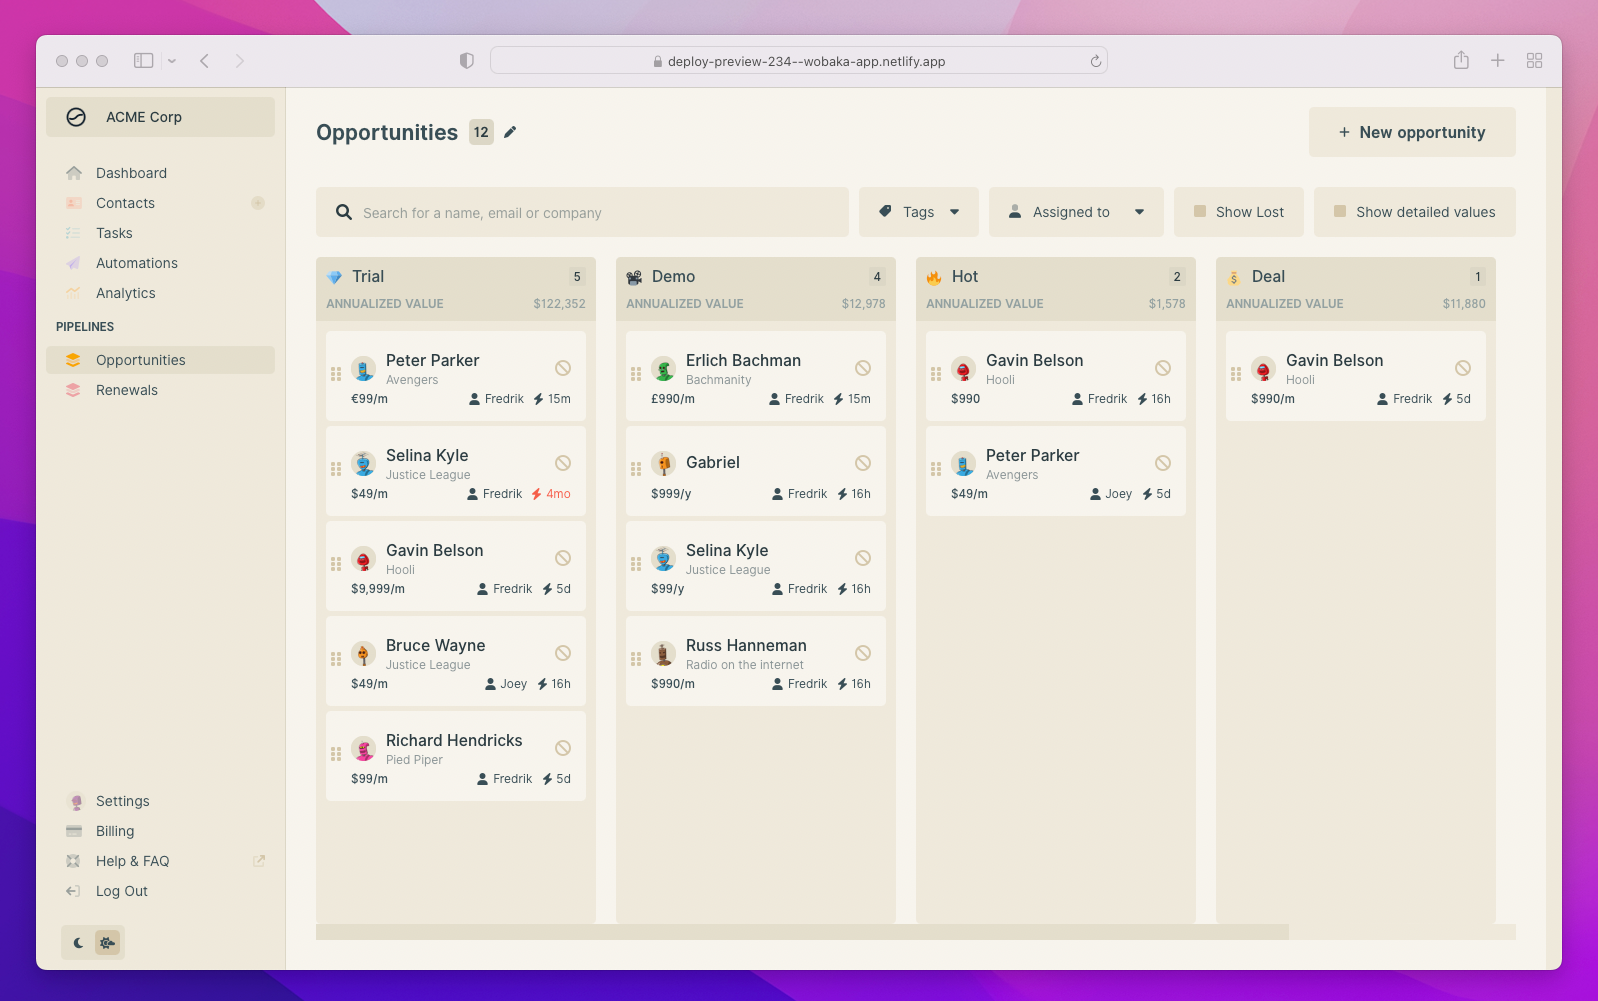
Another thing you might notice is that there's only one currency shown here. In order to make the view simpler, I decided to only show your default currency.
Ofcourse, sometimes you want to see more detailed data and that's what the Show detailed values checkbox is for. Toggling this will show you a detailed report for each currency and period that is present in the stage.
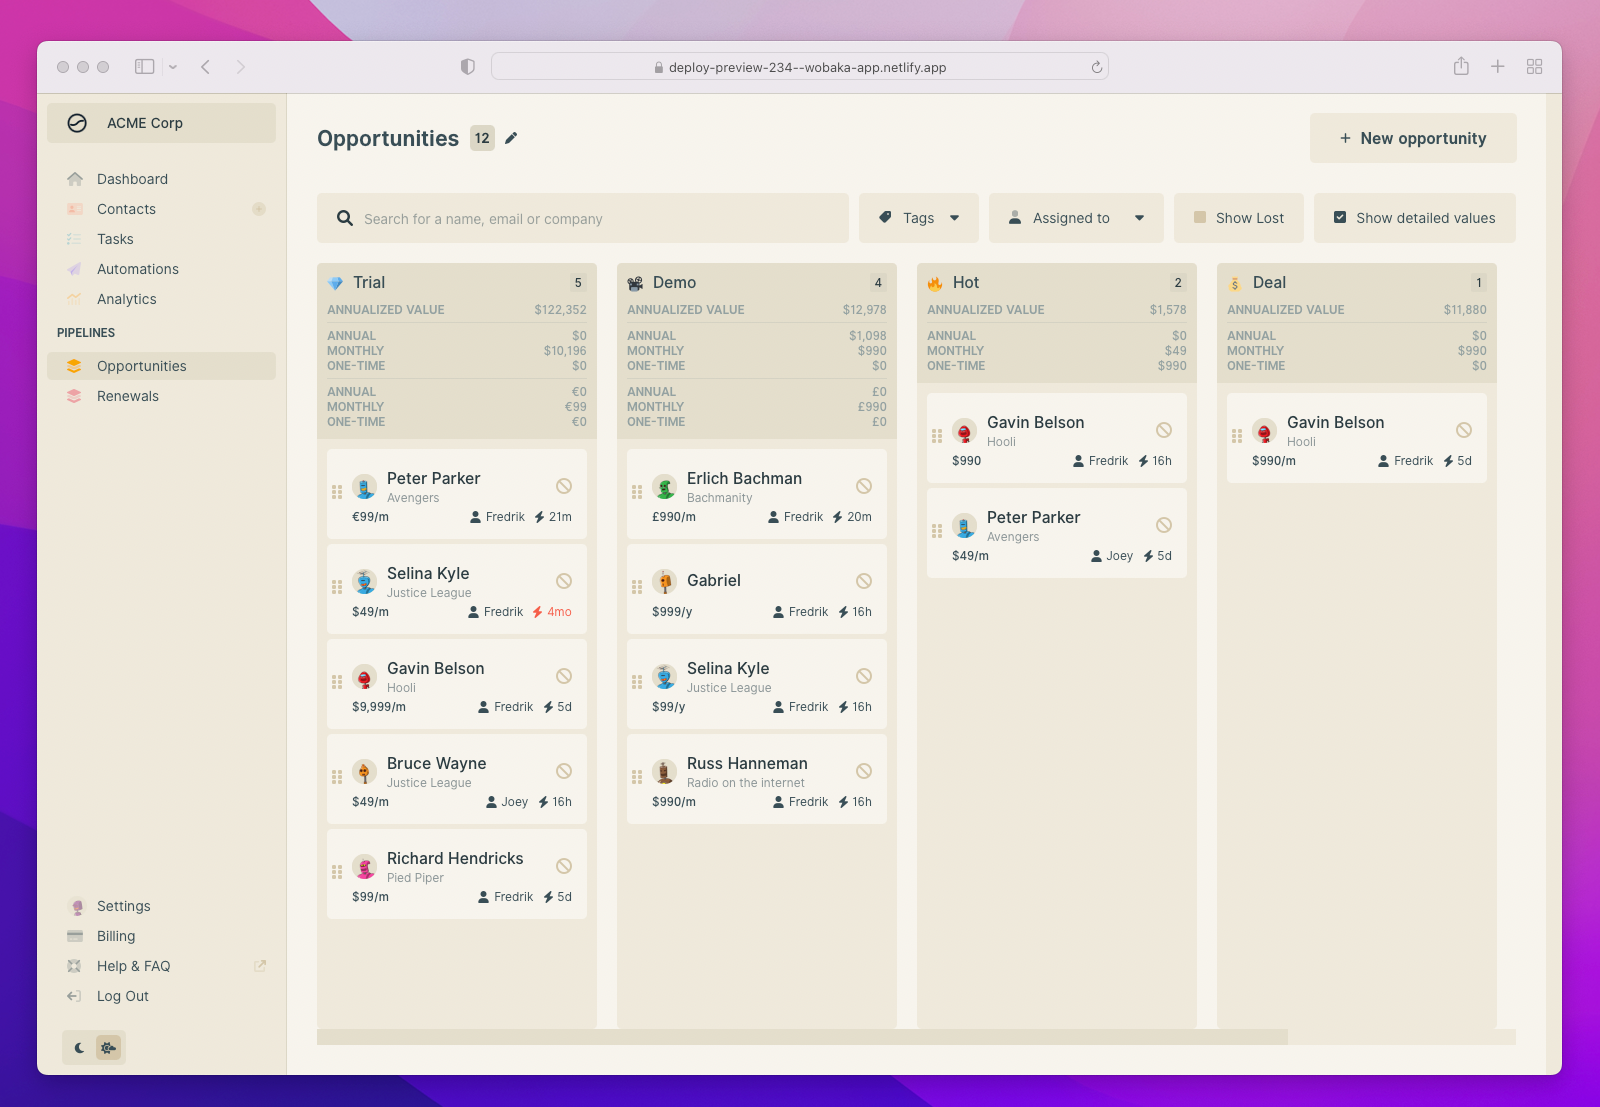
And since this blogpost wouldn't be complete without a screenshot of what it looks like in dark mode, here you go! 🌚
Customize your pipelines
Don't forget that you can create as many pipelines as you want. Just head to Settings > Pipelines. You can also customize your stages by clicking the ✏️ or Add stage button on the pipeline page.
You can always reads more about how to manage your pipeline and other things on our documentation site here.
That's it for now
Now you get a simplified view of your stages but can also dig deeper and see reports for each currency and period.
Let me know what you think on Twitter @drikerf or by sending me an email to [email protected].
